Powerful real estate insights driven by proprietary property, owner, and market data not available anywhere else.

Get the full story on any on- and off-market property, including ownership details, investment potential, and comparison to other homes in the neighborhood.

Including contact info, ownership type, age, ownership duration, debt, equity, and multi-property ownership.

Property and owner characteristics that signal propensity to sell, including owner age, equity and mortgage details, property size, and ownership duration.

Including occupancy status, condition, rental income estimates, property value, ADU signals, and year built.

Landon does the heavy lifting so you can focus on decisions. Ask anything—from property-level insights to market-wide trends—and get instant, data-backed answers tailored to your goals.
Enhance your real estate data with verified property owner information and property reports, including condition and mortgage details.
Easily enrich your records with owned properties, phone numbers, emails, and current addresses.
Search by full name, reverse phone number, or reverse address—or combine them for even high confidence.

Zoom from a single property to neighborhood up to national scale, revealing the patterns, risks, and opportunities others miss.
Our proprietary map overlays turn complex real estate data into clear, actionable insights. Whether you’re evaluating a neighborhood, scouting the next high-growth zip code, or comparing cities coast-to-coast, you’ll spot patterns faster.
Identify patterns in vacant vs. owner- vs. renter-occupied homes.
Understand where returns concentrate - and where untapped value lies.
Spot properties with strong equity positions or elevated financial pressure.
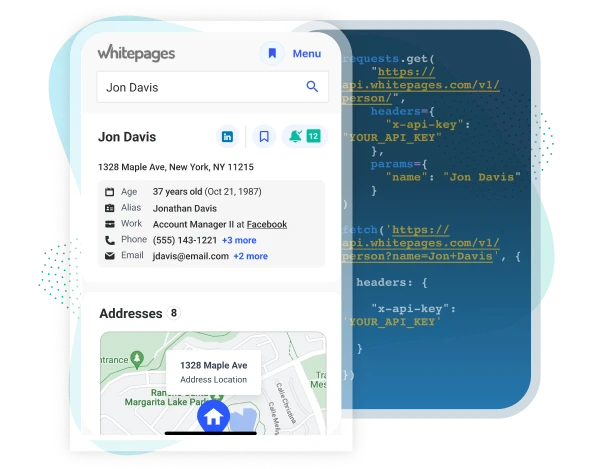
Enrich contact data, verify identities, and get ownership insights with the industry-trusted Whitepages Pro API built on 4B+ data linkages and 25+ years of data-matching expertise.
Enhance your real estate data with verified property owner information and property reports, including condition and mortgage details.
Easily enrich your records with owned properties, phone numbers, emails, and current addresses.
Search by full name, reverse phone number, or reverse address—or combine them for even higher confidence.


Get up-to-date contact info and owner profiles
Identify motivated sellers using sales signals like equity, ownership tenure, and property size
Prep for listings with deep property and market insights

Understand occupancy and condition of surrounding homes
Dive into the factors driving a property’s value, price, and owner motivation
Assess the condition before going onsite

Spot distressed or undervalued homes using equity, condition, and ownership data
Discover off-market opportunities and owner motivation to sell
Pinpoint fix-and-flip or buy-and-hold candidates

Vet home improvement prospects and update contact information
Surface high-potential opportunities
Differentiate between absentee owners and residents
Property and owner info for over 127 million on and off-market properties nationwide.
Best-in-class property data powered by Whitepages and designed to help you make smarter investing decisions.
Whitepages meets the needs of tens of millions of consumers and small businesses per month.